
An Opportunity to Learn the Impact of Data Dashboards on Educational Marketing
Do you know how a Data Dashboard can push your Environmental Educational Marketing efforts to the next level? We do! In honor of Earth Day, we are sharing some of our favorite earth-centric Data Dashboards that you can take note from, model after, and create your own to do things like promote species conservation, educate on sustainable development, or build content for travelers that buy ecotourist packages.
What are data dashboards?
Data dashboards are a way to visualize key data in a way that numbers and statistics alone cannot convey to a general audience. Commonly, data dashboards are used for making business decisions and modeling data in a way that allows decision makers to visualize the information they need to know in order to make data-based educated decisions. Often these business dashboards display KPI (key perform indicators) and key data points across company departments that drive business decisions. Taking this same methodology and applying it to important worldwide topics and issues like the health of the planet, particular species, ecosystems as well as environmental and sustainable development can help educate and market on important efforts.
In honor of Earth Day, I would like to spotlight some great earth-centric data dashboards created by different designers who showcase their creativity in an inspirational way that you can learn from and begin developing your own online interactive tools for your audience.
Raise Awareness, Raise Funding
Raising awareness and education for a species, cause, or non-profit effort. Educational facilities, aquariums, an animal rescue center, or any related entity can use similar efforts to this beautifully built dashboard by Jonni Walker exploring Hawk Migration. In this Data Dashboard of the Swainson’s Hawk you can see the use of map interactivity, video, and well-displayed visuals and data. The chart is click-able and highlighting the migration journey of the Swainson’s Hawk through the Americas. By creating tools like this, you can up the interactivity factor of your content while raising awareness of a particular cause or species. You can even add an interactive component to your dashboard soliciting donations or data collection participation to continue the research and support efforts of your program.

Environmental and Sustainable Development
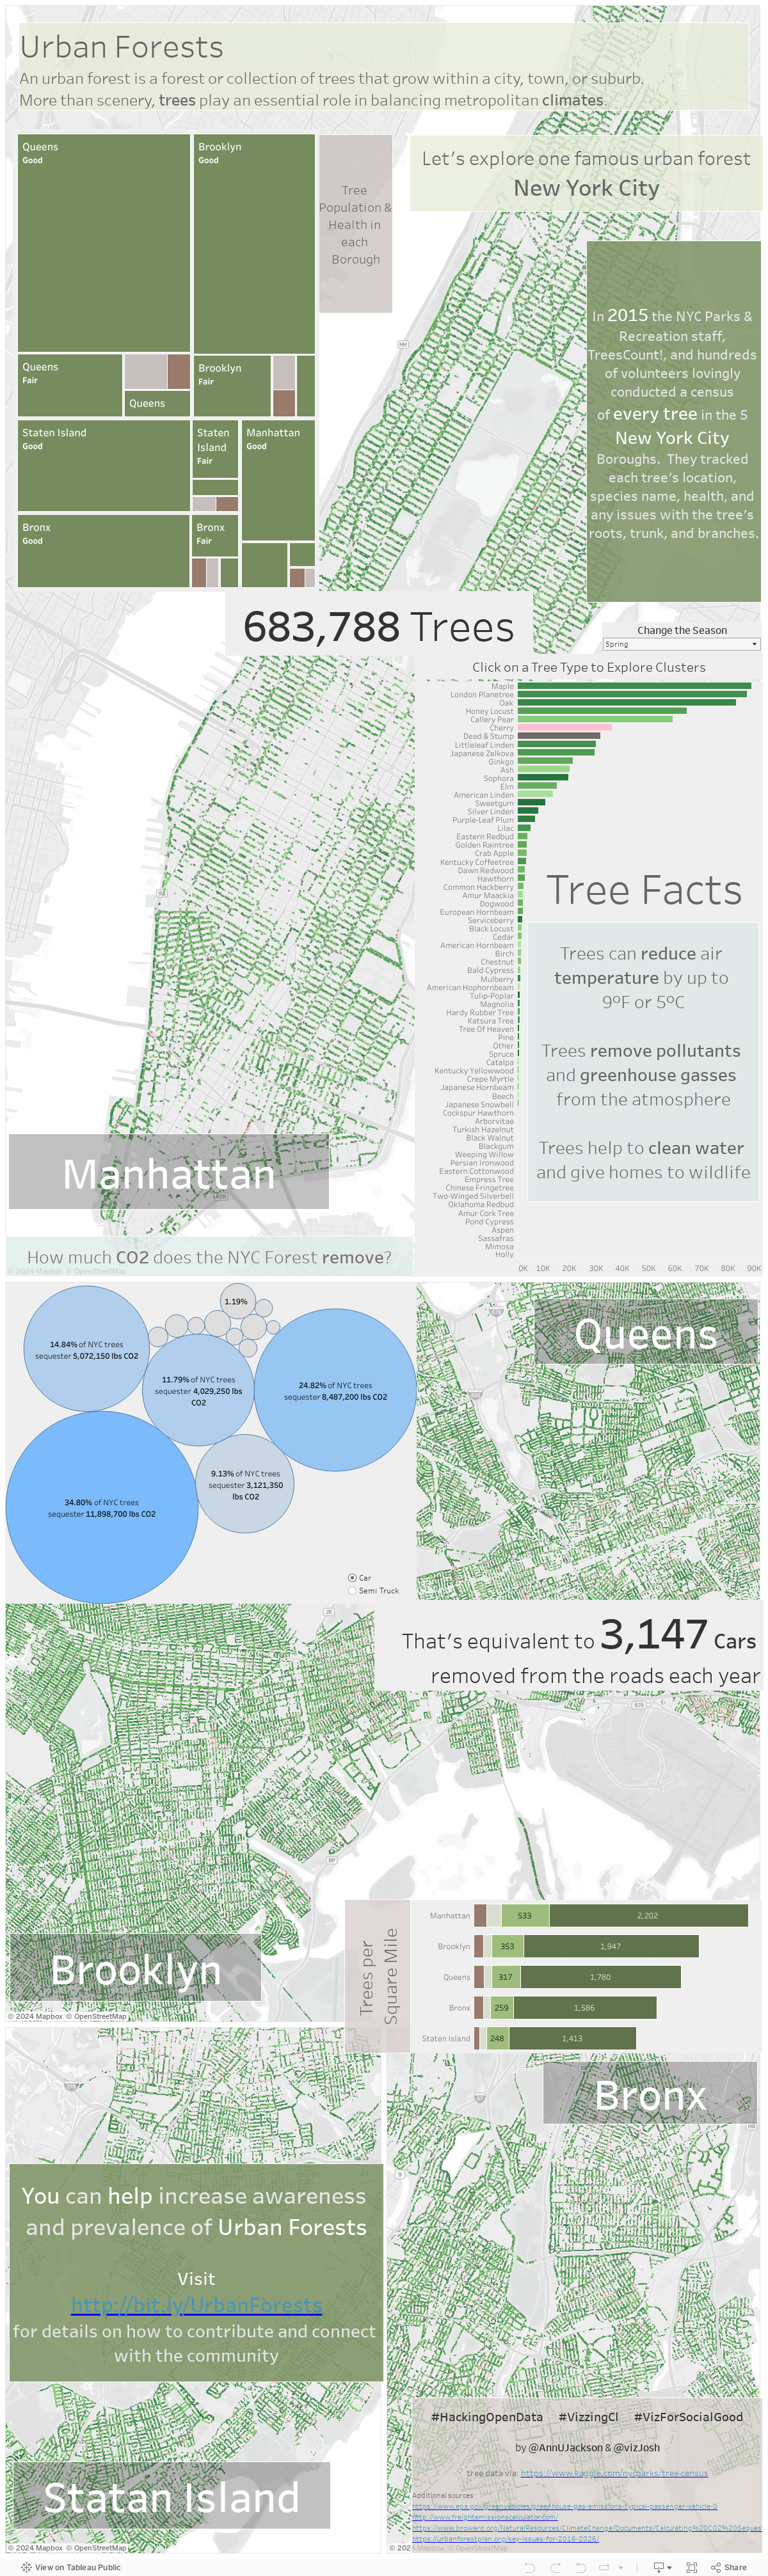
Urban Forests are a key value to city dwellers and large green spaces promote the sequestration and natural breakdown of common hazardous urban pollutants like ground-level ozone, sulfur dioxide, nitrogen dioxide, and carbon monoxide. Displaying these key-to-health urban forests and developing an educational program for citizens can allow City Planners and Eco-Development businesses alike to garner the support of residents and investors to opt-in to sustainable development. Using these interactive tools, companies can expand their innovations to inspire a wider audience to live better, be wiser, and invest intelligently in our cities, energy usage, and our homes. It would be interesting to see these innovative Prefab Sustainable Homes Companies like Hive Modular, Living Homes and IdeaBox drive educational efforts like Urban Reforestation to drive their combined efforts of education and sales to develop healthier cities and homes.
In this example Urban Forest of NYC Authors Ann Jackson and Josh Jackson have developed a hover over map that shows tree species locations as well as a bubble chart that updates carbon sequestration data.
Digitizing Your Ecotourism Content & Promoting Conservation Efforts
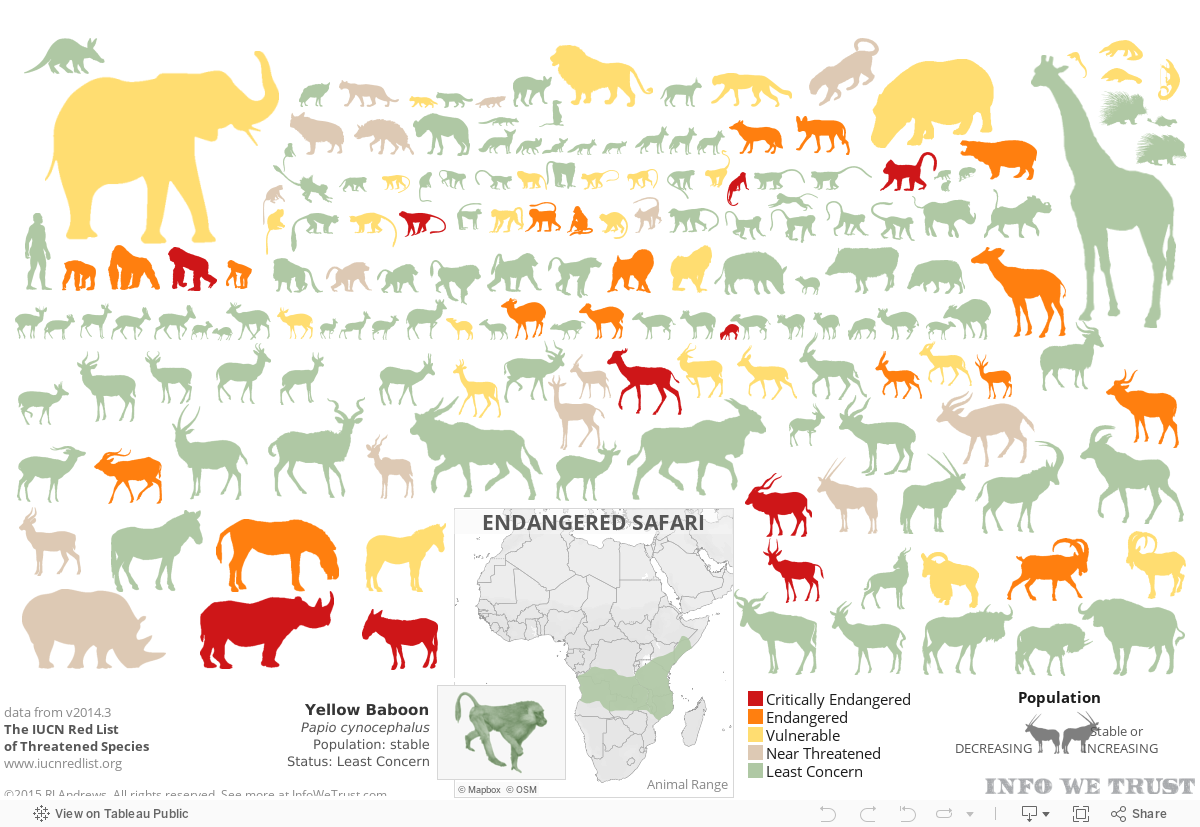
Ecotourism is a huge and growing sector of the Travel Industry. With growth in this more educationally driven travel cohort, more and more ecotourism companies are upping their educational game and turning to data dashboards for teaching ecotourists subjects in more interactive and clever ways. This data dashboard, Endangered Safari by RJ Andrews shows very interactively, the population stability as well as the endangered status of African mammals. This is a perfect example of using digital educational tools that travelers can pull up on their smart devices while taking a tour and learn as they journey along on their ecotravels during and after their trip. It is also content that will be highly shared amongst educational institutions, museums, and special interests groups related to the conservation efforts of your travel agency.
We hope you have learned a little bit more about how Data Dashboards can be used to help educate and market your environmentally focused efforts. If you need help Managing your Data Dashboard Projects, contact us. We’re always happy to geek out with your content and grow your efforts!
[su_button url=”mailto: info@armarketinghouse.com” background=”#dcae1d” size=”5″ center=”yes”]Give us a shout[/su_button]